
21.03.2021
…and how you can use them better for yourself thanks to KIWI HEALTH…
Charts usually display tabular data graphically and facilitate the analysis of the corresponding values via such visualization. The charts in KIWI HEALTH also offer numerous options for gaining even deeper insights into your own data situation and benefiting from useful additional insights.
What options are available and how to apply them is explained in this article.
Why, why, why?
With all the effort that goes into collecting and recording health data, there is only one goal at the end of the day: evaluating the data and gaining insights.
To achieve this goal, appropriate tools are required that ideally offer a healthy mix of user-friendliness and functional scope. Unfortunately, however, these two requirements usually contradict each other, since an expansion of functionality is inevitably accompanied by more complicated usability. At KIWI HEALTH, we try to find a healthy middle ground to ensure a quick glance as much as an in-depth analysis.
In the following, the extensive possibilities offered by the diagrams in KIWI HEALTH are presented.
Advanced functions in the diagrams of KIWI HEALTH
- Predefined time limitation of the data to be evaluated
Via the pull-down menu “Period” you can preselect the period for the data to be displayed. - Grouping
Via the pull-down menu “Grouping” you can define how detailed the data should be displayed (i.e. grouping and thus summation of the values over days, calendar weeks, months, quarters or years).
Notice:
The default setting per health value is made in KIWI HEALTH in such a way that this selection makes sense for the initial display.
Displaying blood pressure at the time measured is more beneficial than grouping it throughout the day. However, to establish a trend, grouping by calendar weeks, for example, may be more meaningful.
The situation is different, for example, with the number of steps. Here, it is not the exact time but the daily sum that is more meaningful. And this is exactly the default setting for this value. - Timeline
By positioning the left and right borders on the time bar, you can specify any time period to be displayed in the chart. - Zoom
Use the mouse scroll wheel to zoom in and out of the diagram. Position the mouse cursor at the point of the diagram which should be used as an anchor for the zoom. - Enlarge area
Select a selection rectangle by holding down the Shift key and the left mouse button.
After releasing the mouse button, the selected area will be enlarged. - Scroll
With the scrollbars of the X- and Y-axis or moving with pressed left mouse button in the diagram area you can position the visible area of the diagram exactly to the place you want to take a closer look at. - Normalize and optimize
In the normalized display, the values in the graph are displayed from zero to the highest value.
In the optimized display, the Y-axis is “stretched” from the smallest to the largest data value. This makes it easier to see changes in values by more clearly displaying the slope and gradient. - Trend line
The trendline shows you in which direction (up or down) your values are developing. Use this insight to counteract a negative trend. - Average line
The average line shows you at which level your values are. - Copy to clipboard
Clicking this command button copies the currently displayed diagram as an image to the clipboard.
With Ctrl-V or “Paste” you can paste this image into any other application that can process images (e.g. Word). This function allows you to create an individual report according to your wishes. - Excel export
The tabular data basis for the chart can be exported as an Excel workbook.
And what do these functions do for me?
Unlike most apps and web applications that analyze your health and fitness data, the charts in KIWI HEALTH are not static, but can be dynamically customized by you.
The advantage is that you can evaluate your values in much more detail due to the options for individualization. This way you gain more knowledge about your health condition.
The following two examples illustrate the advantages
In the first example, the weight is evaluated and shows the difference between normalized and optimized representation of the graph.
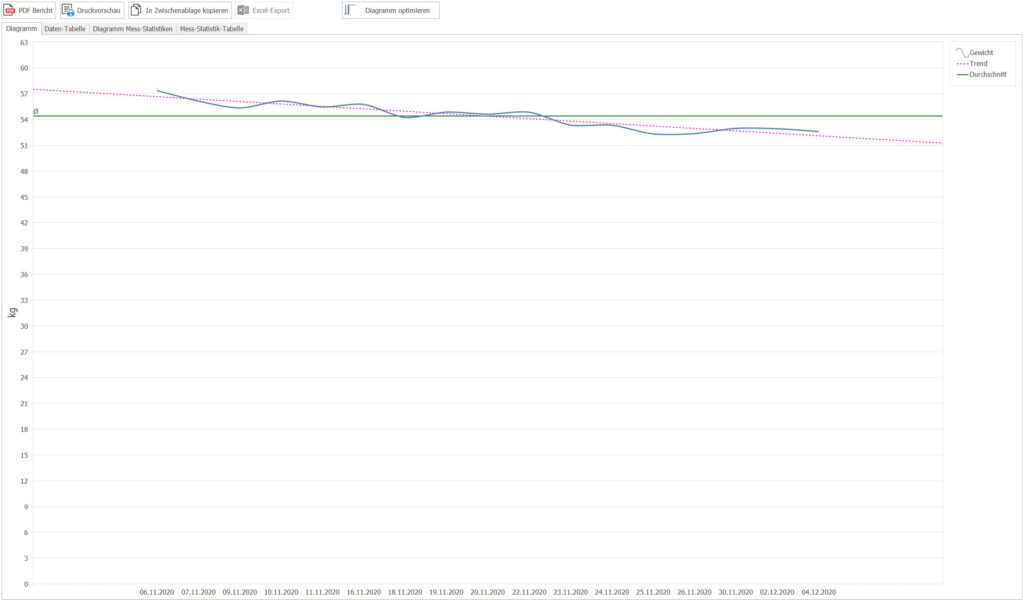
Fig. 1 shows the course of the weight measurements in normalized form. Although it can be roughly read from the tendency and the course that an overall weight loss has taken place in the selected period, fluctuations and major changes are only faintly discernible at first glance.
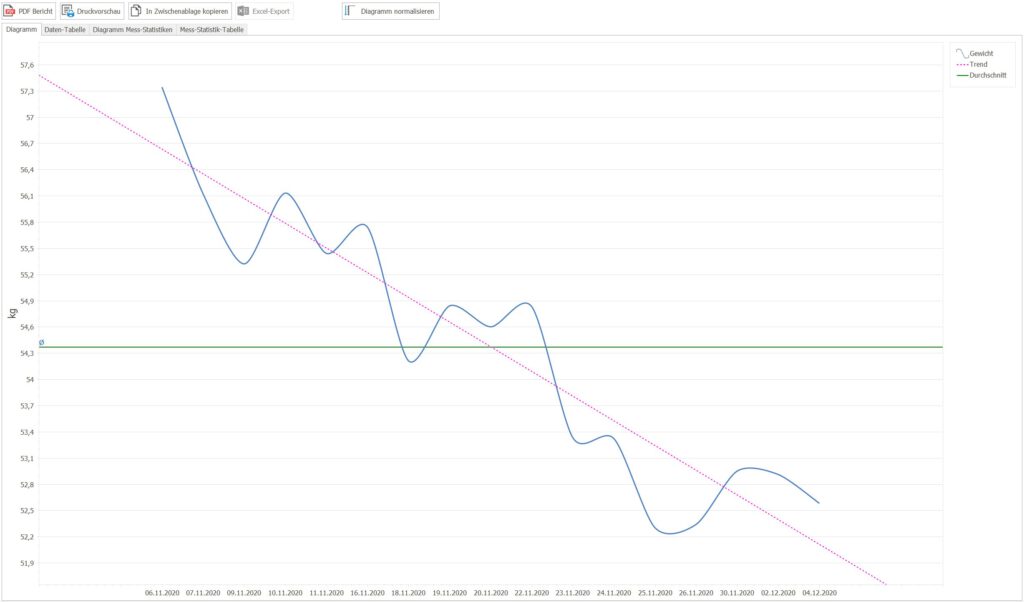
In fig. 2 the diagram is displayed optimized. The individual values are displayed stretched from the lowest to the highest value. Now the changes in weight become a lot clearer. And also the tendency of the course is shown much more prominently.
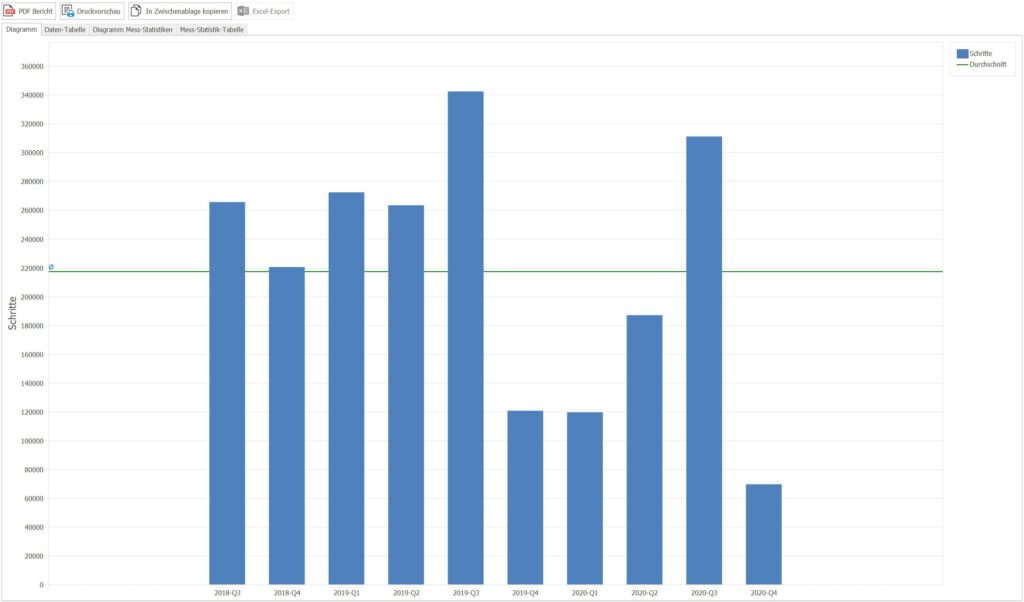
This example illustrates the different display in the diagram when the grouping is changed. The steps are evaluated.
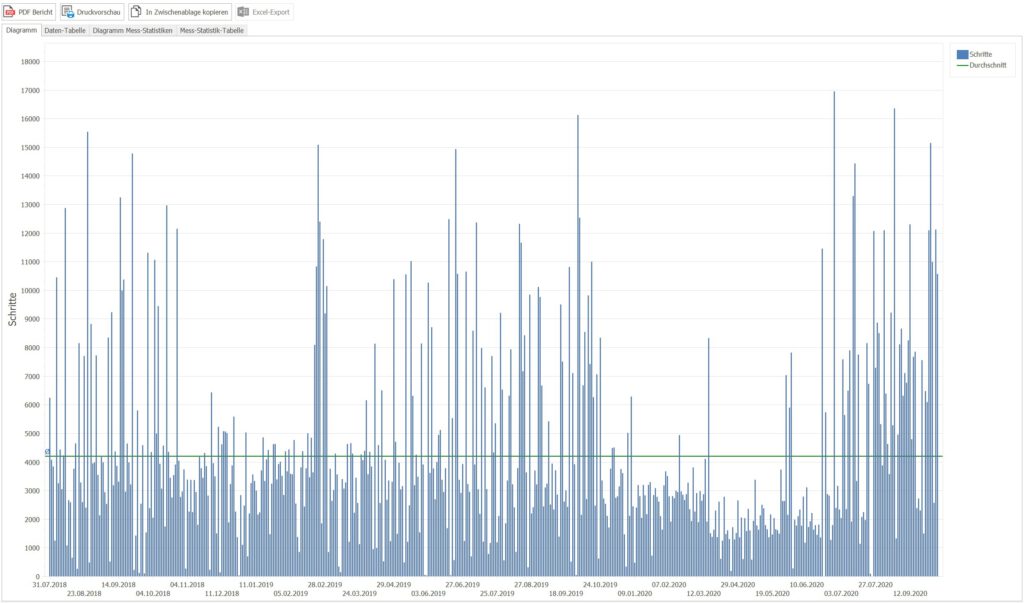
In fig. 3 you will see the number of steps walked per day over a large period of time. An evaluation of this diagram is anything but simple and probably also not purposeful.
In fig. 4, the selection for grouping was changed to “Quarters” for the same period. This makes the evaluation of this diagram much easier. Now it becomes clear that before 2020 (with one exception in the 3rd quarter) more steps were counted (and of course walked).
Conclusion
What is the use of collecting data if its analysis is limited?
That’s right…not really much….
We have eliminated this shortcoming with an expanded range of functions in KIWI HEALTH. And although the charts offer powerful features, the default settings are such that you’ll get a meaningful chart right away in every case.