
23.04.2023
If you’re evaluating your health data and notice anomalies, or if you just want to highlight a particular value with a comment, KIWI HEALTH’s latest extension lets you add annotations about your Apple Health data right in the chart.
In this way, you not only have all your questions and thoughts directly at hand when talking to your doctor, you also can provide them as a printout. Your own reflections and observations will also serve as a basis or thought support for future evaluations.
All other new features in this update can be found at the end of this post.
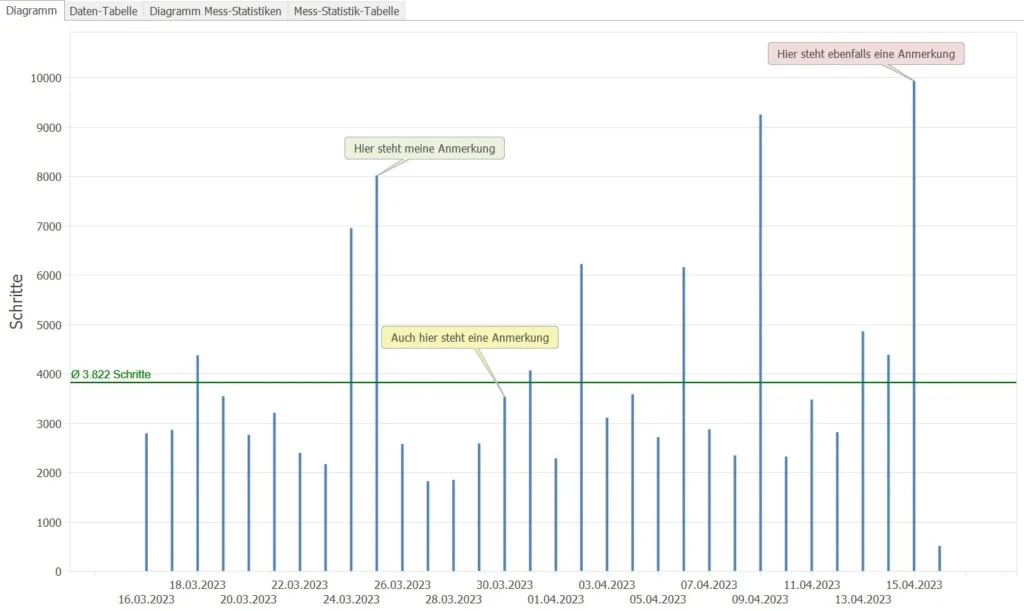
With this update of KIWI HEALTH, you can enter any text as a note for each data point in the graphs in both the “Evaluate Health Data” and “Compare” report pages. In all other diagrams the commenting function is not provided so far.
You can freely define the text and background color as well as the position. Newly created or deleted annotations are immediately updated in all loaded diagrams, so the display is always up to date.
Note on annotations:
An annotation for a data point is defined by the time (X axis) and the value (Y axis).
Therefore, your annotations will appear in the charts only as you have previously set the display of the grouping.
Example:
If you set the view of a chart in calendar weeks and create annotations there, but later change the setting to months, you will not see these annotations in the month view, but only in the previous week view. As the daily values (sum or average) are displayed in the “Comparison” report, only the notes for the “Day” grouping are visible here as well.
Tip:
Try to be as brief as possible, as the number of characters per entry is limited to 255. You don’t want to print out pages of novels later, but you want to keep an eye on the diagrams.
And this is how it works: Create, edit and delete annotations
To create, edit or delete an annotation, move the mouse over a data point and click the right mouse button.
This opens the editing window.
IMPORTANT!
The data point for which an annotation is to be created must be marked exactly with the mouse pointer.
If the editing window does not open by right-clicking, no data point was detected at the position of the mouse pointer.
Tip:
If many data points are displayed in the diagram, it may be difficult to clearly mark the data point with the mouse. Then use the zoom function of the diagram (“mouse wheel”) to enlarge the section. This way, the data point can be highlighted more easily.
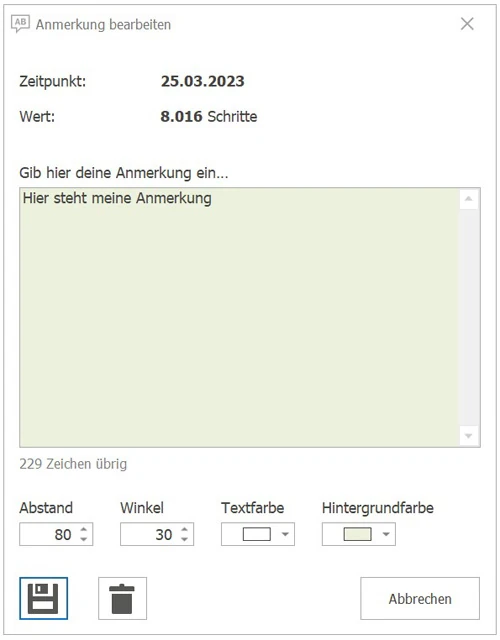
The editing window
This input mask is used to enter the text and options for an annotation.
Depending on how many comments you write or how many values you comment in a chart, you have the possibility to position the text fields accordingly. You can set the distance and angle individually to separate the comments from each other. This way you avoid overlapping or confusion. In addition, you can specify the text color and the background color, e.g. to highlight the importance of a comment with the traffic light colors.
The content of the annotation editing window:
Info about the data point
- Time
- Value
The text of the annotation and below the input field the indication of the remaining characters.
Settings for the annotation
- Distance:
the distance of the annotation to the data point
allowed values are from 50 to 200 (default = 80) - Angle:
the angle of the annotation to the data point
allowed are values from 0° to 360° (default = 30°)
0°: horizontal right
90°: vertically above
180°: horizontal left
270°: vertical below - Text color
- Background color
Notice:
The text and background colors are immediately displayed in the annotation text box, but are not visible in the chart until you click the “Save” icon. This way, you can still decide to discard or change everything before you commit. Even after saving, you can edit your comments at any time, either by right-clicking on the corresponding data point again, or by using the Edit icon or double-clicking on the line in the list of all comments.
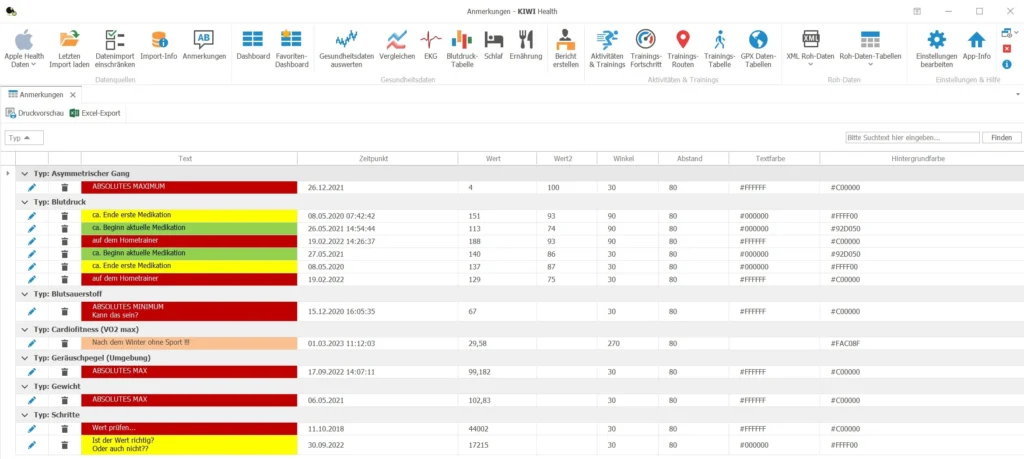
Show all annotations
You can get an overview of your comments by clicking the “Annotations” button in the main menu.
The list gives you an overview of all data points you have commented. Here you can also edit your texts and settings afterwards by clicking on the edit icon or double-clicking on the row. Condition for this is that you have loaded the corresponding health value before, otherwise the note is listed in the overview, but can not be edited.
Other new features in this update
In addition to some minor optimizations and bug fixes, an option has been added to your user settings to specify any folder where you save your export files. Ideally, you’ll enter a locally connected cloud folder here, which you’ll select when saving your health data in Apple Health.
In the reorganized “Apple Health Data” menu, the last 20 Export.zip files are then listed sorted from new to old. This will give you faster and more convenient access to your export .zip files. The two command buttons “Import Apple Health data” and “Open Temp folder” have also been moved into the new menu item, and the contents of the Temp folder are also listed sorted from new to old.
In addition, the data tables of the compressed values (including activity energy, heart rate, noise level, steps, etc.) are available under the menu item “Raw data tables” – “Compressed data tables”.
Do you like these innovations?
Simply submit a review for KIWI HEALTH on the store pages. All you have to do is log in to your customer account beforehand. We look forward to your feedback!