
01.02.2022
You are what you eat. Yes of course, everyone knows this hackneyed phrase! But do you really know what you’re eating? With the popular nutrition apps you get a good overview, tips and diet suggestions. But if you want to learn even more about your eating habits, then the latest extension “Nutritional Analysis” in KIWI HEALTH is just the thing for you.
Foreword
Could you tell your nutritionist, fitness center coach, or doctor off the top of your head what vitamins and calories, nutrients and ingredients you consumed over a period of time, in combination or interaction with other data, such as your sleep, exercise, or blood pressure?
With the findings from the nutritional analysis in KIWI HEALTH, you can determine how your eating habits are doing, so that you can then plan and implement a targeted change and thereby make your diet healthier and more balanced. You can set your own goals or ask a nutritionist to help you.
One thing is clear: a watertight and, above all, helpful analysis of your eating habits involves a bit of work, because unfortunately there is no tracker for your food intake. In order to get good results, you should record as accurately and completely as possible what you have just eaten or drunk in a nutrition app over a manageable period of time (approx. 2-3 months). The better the data basis, the more meaningful the evaluations. And if you want to compare time periods, then the procedure repeats 2-3 times a year.
Structure of the analysis
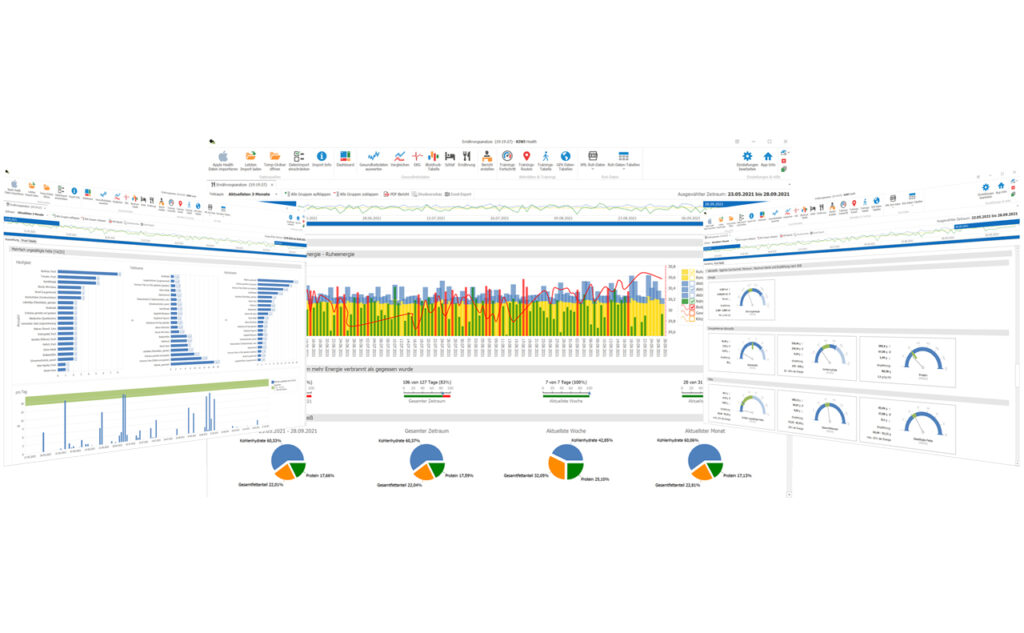
The evaluation consists of five main areas and further sub-areas, distributed over two tabs. In addition, you can use a time bar to define any period over which the evaluation takes place.
“Evaluation” tab
- Overview
- Timeline for free selection of any period for the evaluation
- Course: Food energy – activity energy – rest energy
- Percentage of days on which more energy was burned than eaten
- Distribution: carbohydrates – fat – protein
- Food intake:
- Meal times
- Average calorie intake
- Food: frequency and quantity
- This area, consisting of four graphs (frequency – lows – highs – per day), can be shown or hidden in detail for each nutrient
- Nutrients: daily average, minimum, maximum values and recommendation from the DGE (German Nutrition Society).
- the individual nutrients are grouped by their type (energy, fats, vitamins, minerals, water, other) and are further subdivided if necessary (e.g. minerals by bulk elements and trace elements)
“Pivot table” tab:
- Tabular listing of food intake in detail per day and nutrient in a configurable pivot table
Overview

The timeline works in the same way as you know it from all diagrams in KIWI HEALTH.
You can also select a predefined time period via the “Period” dropdown.
If the time period is changed, the display in the diagrams and the pivot table is recalculated.
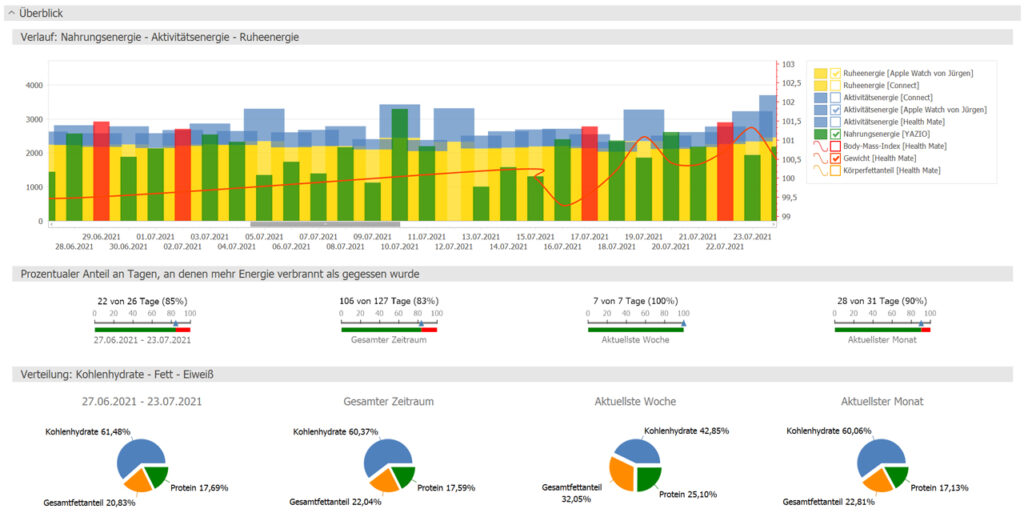
The chart “History” shows you all relevant recorded health data, which you can select and deselect in the legend depending on the source.
Food energy is displayed as a “green” bar if you have consumed fewer calories that day than were burned by activity and rest energy. A “red” bar means you probably went a little overboard that day. The prerequisite for a meaningful display is that the activity and rest energy have been recorded with Apple Health and loaded into KIWI HEALTH.
In the second part, the ratio of green to red bars is calculated for each of four time periods.
The “Distribution: Carbohydrates – Fat – Protein” also calculates the corresponding percentages for the same four periods.
Food intake
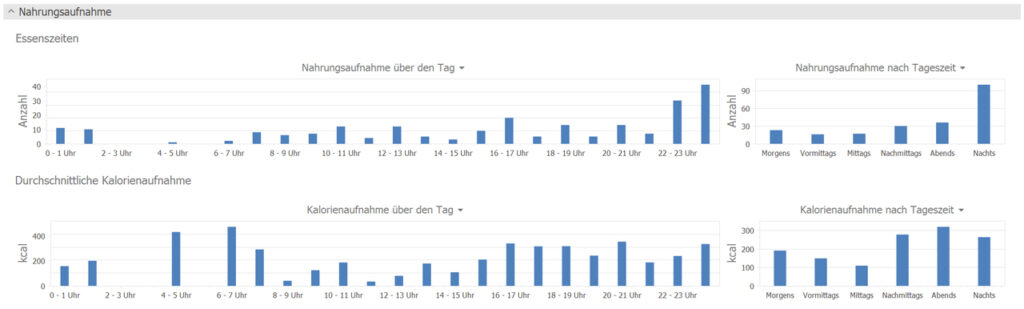
At what times of day do you eat or drink food and how is your calorie intake distributed throughout the day? These two charts give you the answer to these questions, the display is for the time period selected in the timeline.
Food – frequency and quantity
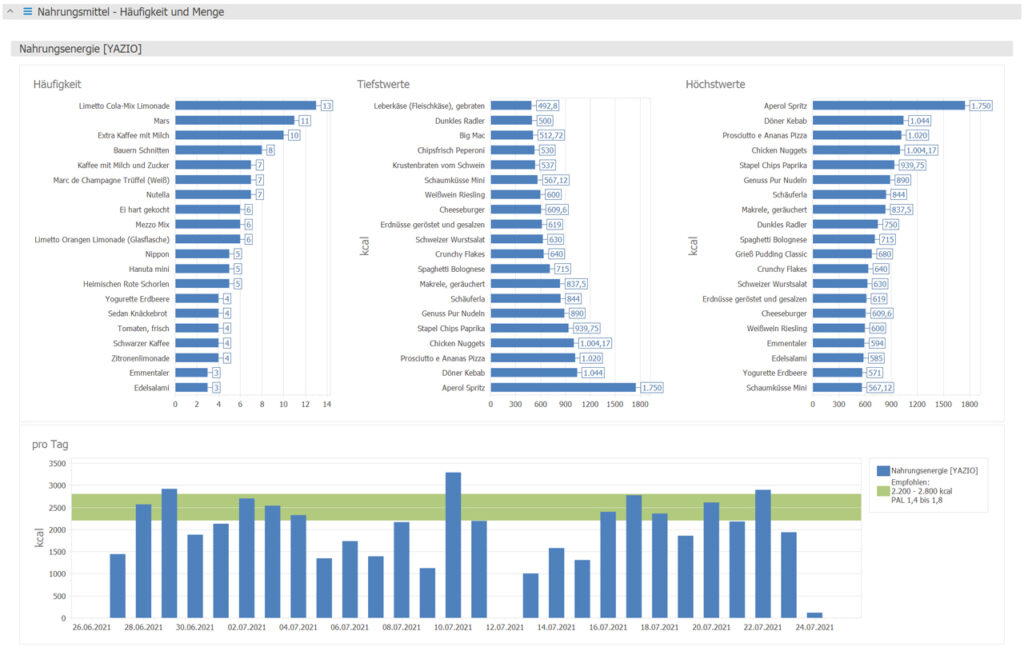
Specifically, what foods do you eat most often and what are their lows or highs per nutrient/energy? The first three charts show you the top 20 values. By default, only the food energy is displayed when loading the nutrition analysis. Using the “hamburger menu”, i.e. by clicking on the three horizontal bars, you can display the diagrams for all recorded values. When clicked, the selection is inserted at the top. Alphabetical sorting is then performed in the PDF report.
The lower bar chart shows the absolute values per day for the selected period. If there is a recommendation of the DGE (German Nutrition Society), then this is marked by the green bar. For the recommendation, your information from Apple Health (gender, age) as well as other measured values such as your weight are used to make the most accurate calculation possible. Food energy is also based on a PAL (Physical Activity Level, or your power metabolic rate) of 1.4 to 1.8.
Nutrients – daily average, minimum, maximum values and recommendation from the DGE
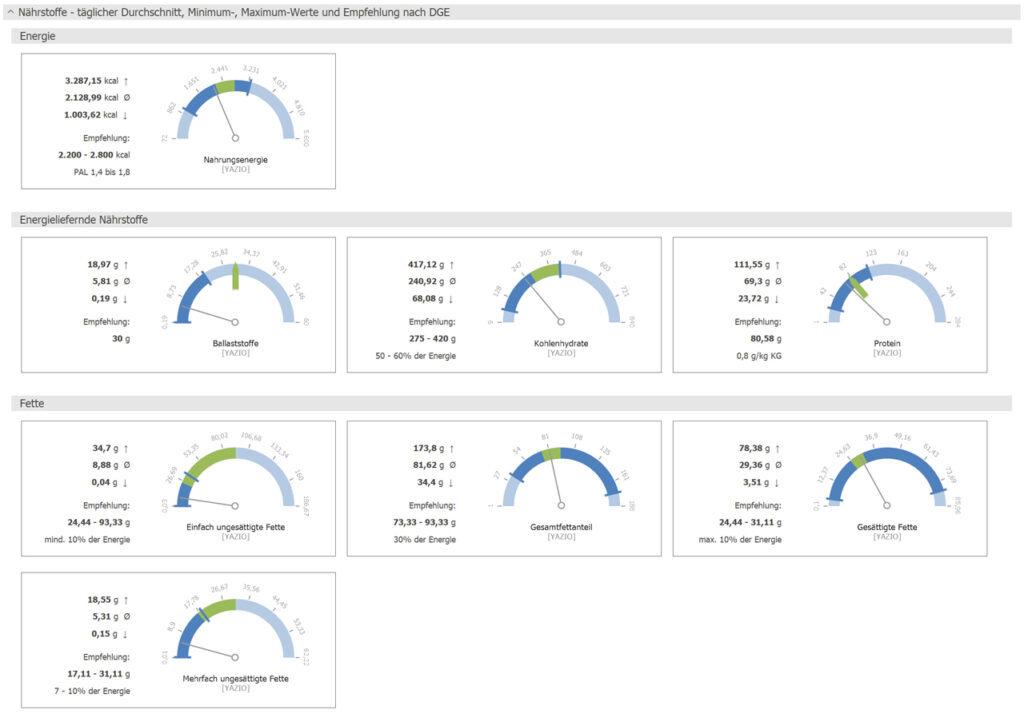
In these diagrams, the minimum, maximum and average values per day over the selected period and the recommendation from the DGE are shown for each individual value of the nutrients supplied. The grouping is done according to the respective type of the value.
Pivot table
Last but not least, you can look at and check all the details in numbers in a pivot table. Up to the day, exportable, with any filtering and grouping of the individual values, depending on the detail level of your records.
Conclusion
Comprehensive, structured, informative and yet easy to read. This is the goal of the nutritional analysis in KIWI HEALTH.
Plus, you’ll always have a clear PDF printout for when you visit your doctor, gym coach, or nutritionist.
KIWI HEALTH helps you to achieve your goals and live healthier through better knowledge and by having a better overview of your eating habits.