
15.07.2021
Apple Health offers good options for sleep analysis. If you use a smartwatch or sleep tracker to monitor your sleep, you can now evaluate it with the latest version of KIWI HEALTH. And that including all recorded data, simple, clear and comprehensive. Find out how in this article.
Sleeping is great. And sleep is important. Significant insights into your health can be derived from your sleep patterns.
Restless or disturbed sleep permanently leads to stress, reduced performance and high blood pressure. It increases the risk of obesity, type II diabetes, cardiovascular disease, and a dysfunctional immune system. Scientists from Graz found out that the reaction capacity after an all-night stay could be compared with an alcohol level of 0.8 per mille. Reason enough to pay more attention to one’s own sleep behavior and to recognize sleep disorders promptly.
So why not analyze your sleep?
One thing is clear: In order to get the most meaningful result, it is necessary that the data is also recorded during your sleep. If your smartwatch doesn’t bother you while you sleep, just keep it on your wrist. If you don’t want to do this permanently, then at least every now and then over a period of a few days or weeks. This is another way to get an incomplete, but still useful evaluation of your sleep data with KIWI HEALTH, which you can use to optimize your sleep.
How does the sleep analysis work and what is evaluated?
In contrast to most conventional cell phone apps, KIWI HEALTH not only evaluates the standard values such as the different times or time periods (gone to bed, fell asleep, woke up, got up, time in bed, sleep phase, wake phase), but all recorded and available data. This includes not only the heart rate or blood oxygen, but also, for example, the noise level, which shows you disturbing influences, the resting energy or the data from your nutrition app.
KIWI HEALTH prepares the data, calculates sums, minimum, maximum and average values and displays them in charts or tables. You can freely select the display and thus set the focus on certain values. And of course, various export options are available (PDF report, print preview, Excel export).
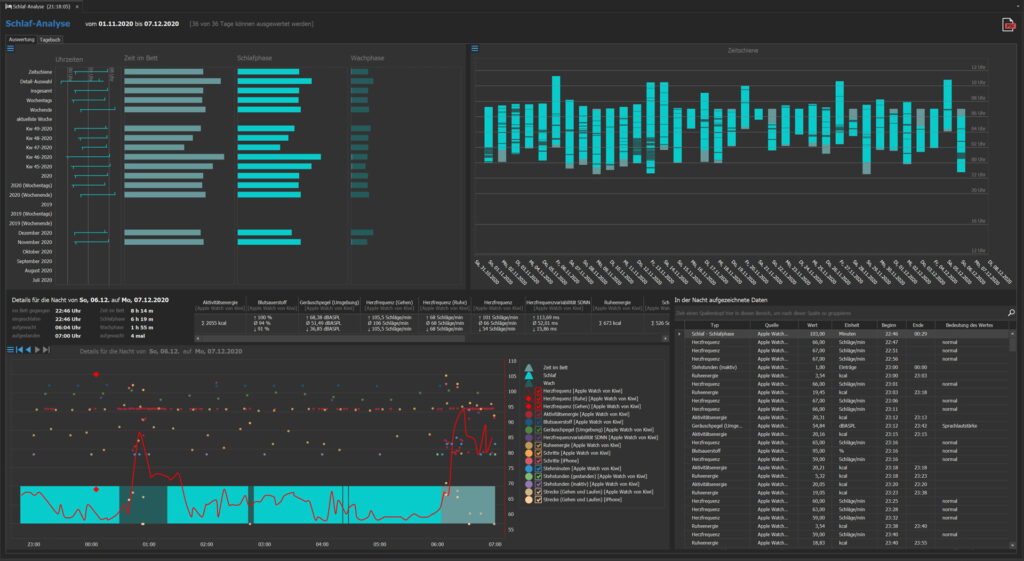
Structure of the page sleep analysis
The sleep analysis is divided into five areas on two tabs.
The areas are located on the“Analysis” tab:
- Overview with average values over different time periods
Here you can switch between a diagram and a table via the menu - Timeline with all days when sleep was recorded
- Detail evaluation for one night
- Recorded raw data in the selected night
The size of the individual areas can be changed horizontally and vertically as desired by means of a movable divider (becomes visible as soon as the mouse moves over it).
The “Diary” tab contains a tabular listing of your sleep data.
The hamburger menus
You can recognize a hamburger menu by the symbol with the three horizontal lines on top of each other. If you move the mouse over it or click on it, a submenu will appear with various options for exporting or customizing the display of the respective area.
The overview diagram with average values
The overview diagram shows the different times for different time periods. This allows for a quick and clear comparison and lets you see trends and the development of your sleep.
The timeline
Bars are displayed in the time bar for each recorded night. Detail bars with all sleep interruptions are plotted for the last three months. The diagram can be scrolled, and zooming in and out is possible with the mouse wheel. A mouse click on a bar sets the focus in the detail area to the selection.
Details for one night
In this area, the sleep of one night and all other data is evaluated in detail. You can navigate back and forth using the buttons. The hamburger menu contains several options for exporting the chart, including that of a PDF report. The legend can be hidden and all detailed data (also individually in the legend) can be selected or deselected.
Data recorded during the night
The table shows all recorded data for the graph displayed in the lower left area. These serve as a data source for the detail diagram and can be printed and exported to Excel.
The sleep diary
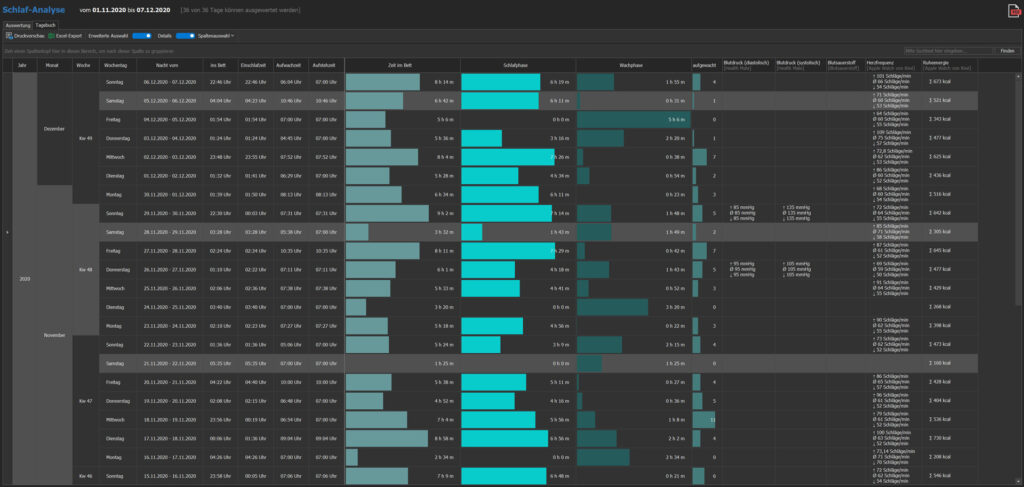
The sleep diary lists all evaluable days in descending order in tabular form. There is a print preview for the table, it is exportable to Excel and can be searched, filtered and sorted.
With the extended selection several contiguous lines can be marked at the same time. By clicking e.g. on the cell with the content KW 24 in the column Week, all rows belonging to this week are marked. By clicking on a day of the week, all rows with the selected day of the week will be highlighted.
If the details are selected, all recorded data are displayed. The desired displayed columns can be selected and deselected in the “Column selection” pull-down menu.
Double-clicking on a specific line automatically switches to the clicked tag on the “Evaluation” page.
More about sleep
You can find out how to assess the quality of your sleep using an index in the article Sleep quality and sleep index.
Other innovations in the July 2021 update
- Health data:
- Display of the last measured value on the overview page
- Display of min/max range in line graphs (optionally selectable)
- Display of the foods for the respective values
- Comparison:
- Improved display when only one data point is present
- Map:
- Display of heart rate in the diagram together with the altitude profile
Outlook
As previously announced, the next update of KIWI HEALTH will include nutritional analysis.
Finally, as always, I would like to thank all the idea contributors and testers who have played a major role in the further development of KIWI HEALTH through their cooperation.
And, of course, there is also a note that user requests for new functions can be made via a support ticket or by sending an e-mail to .